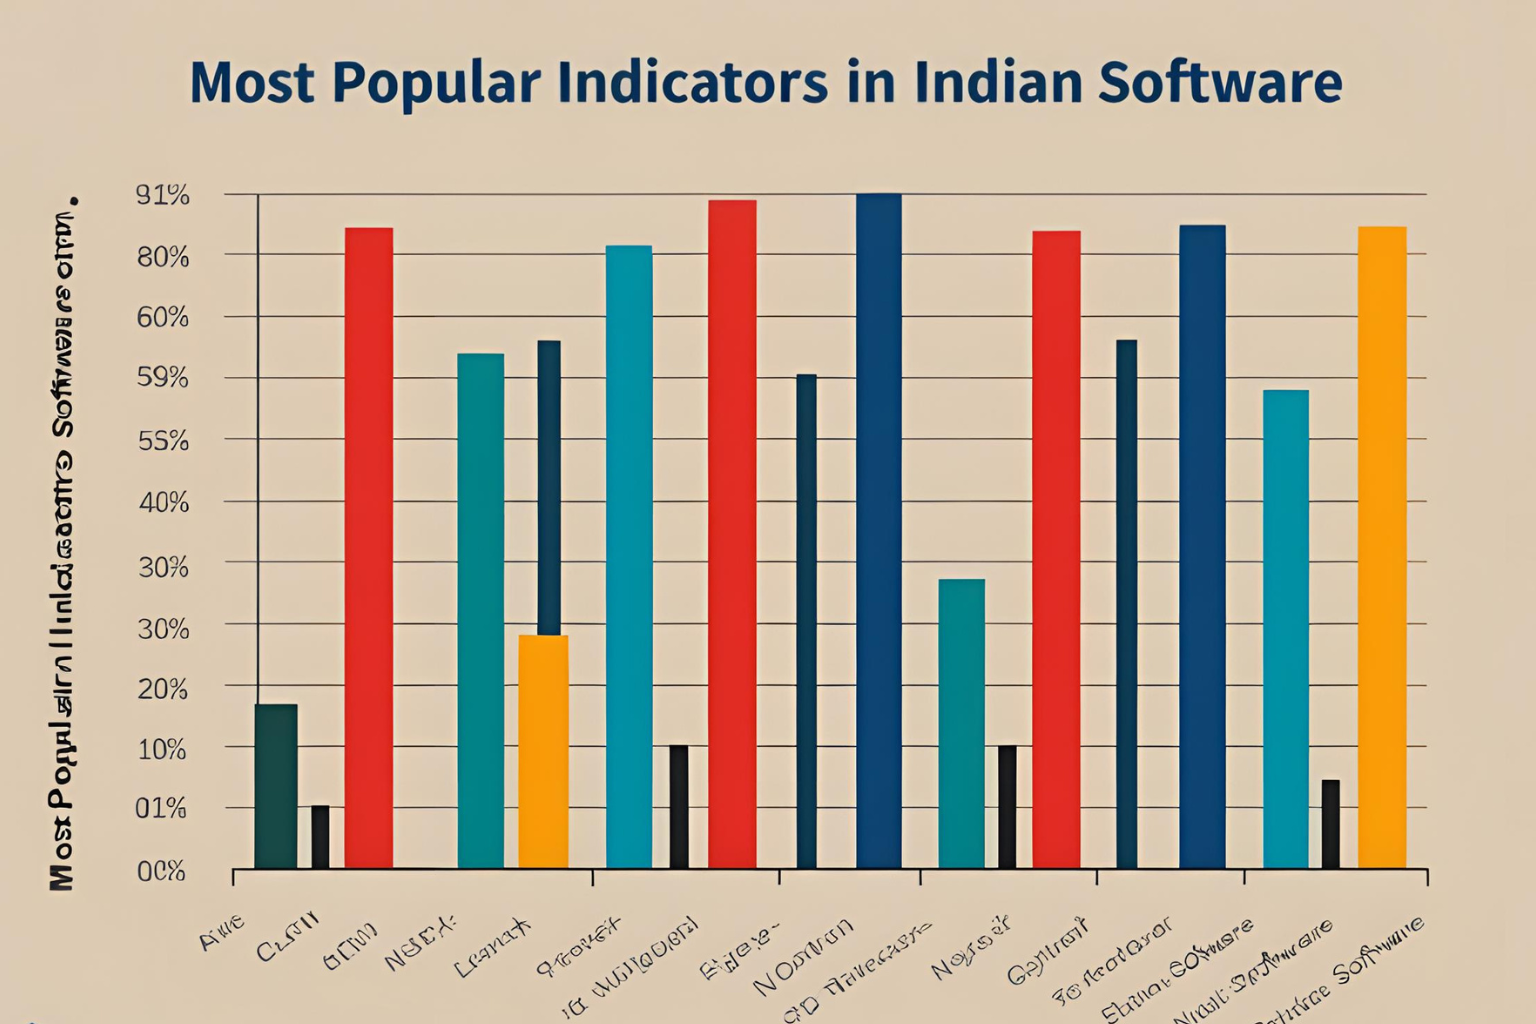
Most Popular Indicators Used in Indian Software
Technical indicators are the backbone of most charting and analysis strategies in the Indian stock market. Whether you’re using platforms like TradingView, Amibroker, Chartink, or Fyers One, having the right indicators on your charts can significantly enhance decision-making.
In this post, we’ll explore the most popular technical indicators used in Indian software, how they work, and when Indian traders prefer to use them.
1. Moving Averages (SMA & EMA)
Why It’s Popular:
Simple Moving Average (SMA) and Exponential Moving Average (EMA) are the foundation of trend analysis. They help identify bullish and bearish trends and act as dynamic support and resistance.
Common Use in India:
- 20 EMA for intraday
- 50 & 200 SMA for positional and long-term traders
- Golden Cross & Death Cross signals
2. Relative Strength Index (RSI)
Why It’s Popular:
RSI measures momentum and overbought/oversold conditions. It’s widely used by Indian swing and intraday traders.
Key Levels:
- RSI > 70 = Overbought
- RSI < 30 = Oversold
Popular Usage:
Used to time entries during retracements or pullbacks.
3. MACD (Moving Average Convergence Divergence)
Why It’s Popular:
MACD helps identify trend strength and potential reversals using a crossover of two moving averages.
MACD Components:
- MACD Line
- Signal Line
- Histogram
Common Signals:
- Bullish Crossover
- Bearish Crossover
- Divergences with price action
4. Bollinger Bands
Why It’s Popular:
Bollinger Bands use volatility to define price boundaries. In India, they are popular for range-bound market strategies.
Key Usage:
- Price touching lower band = potential buy
- Price touching upper band = potential sell
- Squeeze = breakout potential
5. Supertrend
Why It’s Popular:
Supertrend is widely used on Chartink, Zerodha Kite, and Upstox Pro due to its simplicity and effectiveness in trending markets.
Settings:
- ATR Period: 10
- Multiplier: 3
Common Strategy:
Buy when Supertrend turns green, sell when it turns red.
6. Volume and VWAP (Volume Weighted Average Price)
Why It’s Popular:
Volume confirms price action. VWAP is heavily used by intraday traders to gauge average price levels for the day.
Common Strategy:
- Buy above VWAP in uptrend
- Sell below VWAP in downtrend
7. Stochastic Oscillator
Why It’s Popular:
Used to identify overbought and oversold conditions, especially in choppy markets.
Settings:
- %K: 14
- %D: 3
Trading Tip:
Look for crossovers below 20 (buy) or above 80 (sell).
8. Ichimoku Cloud
Why It’s Popular:
Offers a complete picture of market structure in a single glance. It’s popular among advanced traders using platforms like Amibroker and TradingView.
Key Elements:
- Kumo Cloud
- Tenkan Sen / Kijun Sen
- Lagging Span
Best For:
Identifying trends, support/resistance, and future projections.
9. ADX (Average Directional Index)
Why It’s Popular:
ADX helps assess trend strength. Indian traders often use it with other indicators like Supertrend or MACD.
Strategy:
- ADX > 25 = Strong trend
- ADX < 20 = Weak trend
10. Fibonacci Retracement
Why It’s Popular:
Fibonacci levels help traders spot potential support and resistance during pullbacks.
Key Levels:
- 38.2%, 50%, and 61.8%
Usage in India:
Popular among swing traders using NSE charts on platforms like TradingView and Zerodha Kite.
Final Thoughts
The right technical indicator can improve your timing, increase confidence, and provide better risk management. However, the key is not to overload your charts. Most Indian traders prefer using 2–3 indicators that complement each other for confirmation.
For best results:
- Combine momentum with trend indicators (e.g., RSI + Supertrend)
- Always validate signals with volume
- Backtest your indicator setups on your preferred platform
FAQs
Q1: Which is the best indicator for intraday trading in India?
A: Supertrend, VWAP, and RSI are among the most popular for intraday setups.
Q2: Can I use multiple indicators together?
A: Yes, but avoid clutter. Choose complementary indicators like one trend and one momentum indicator.
Q3: Are these indicators available in free tools?
A: Most are available in free versions of TradingView, Chartink, and broker platforms like Kite and Upstox Pro.
Q4: What are lagging and leading indicators?
A: Lagging indicators (e.g., MACD, MA) confirm trends after they start. Leading indicators (e.g., RSI, Stochastic) aim to predict moves early.
Q5: Do professional Indian traders use these indicators?
A: Yes, these indicators are standard tools in the trading community, from beginners to full-time professionals.