How to Use TradingView for Indian Stocks

How to Use TradingView for Indian Stocks

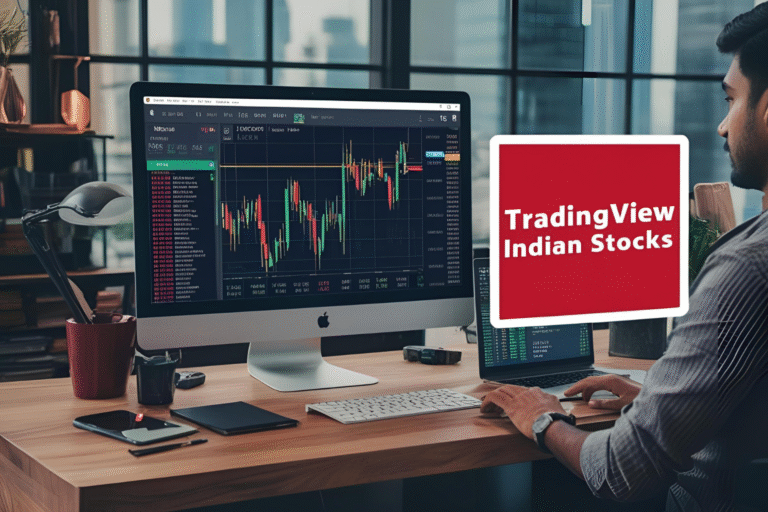
TradingView is one of the most widely used charting platforms in the world—and it’s highly effective for analyzing Indian stocks listed on NSE and BSE. Whether you’re a beginner or an experienced trader, TradingView offers a powerful and intuitive interface to track market trends, apply indicators, and create custom strategies. In this guide, we’ll walk…

How to Do Intraday Analysis with Software

How to Do Intraday Analysis with Software

Intraday trading requires speed, precision, and reliable data. Unlike positional trading, decisions in intraday setups are made within minutes to hours—making it essential to have the right analysis tools and workflows in place. In this guide, we’ll cover how to do intraday analysis using software, with practical steps, tools, and tips tailored for Indian stock…

How to Backtest Strategies Using Amibroker

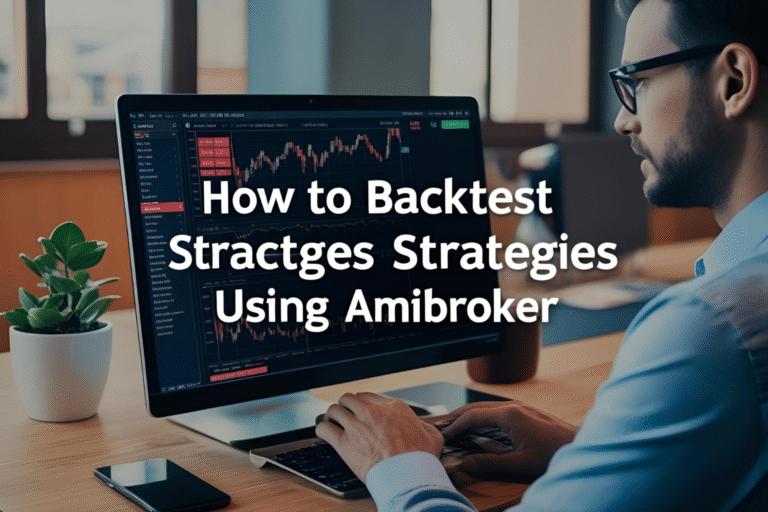
How to Backtest Strategies Using Amibroker

Backtesting is the process of testing a trading strategy using historical data to evaluate its potential performance. Amibroker is one of the most powerful tools available for technical traders in India, and it excels in backtesting with precision and speed. In this guide, we walk you through how to backtest trading strategies in Amibroker, from…

How to Set Up Alerts in TradingView for NSE Stocks

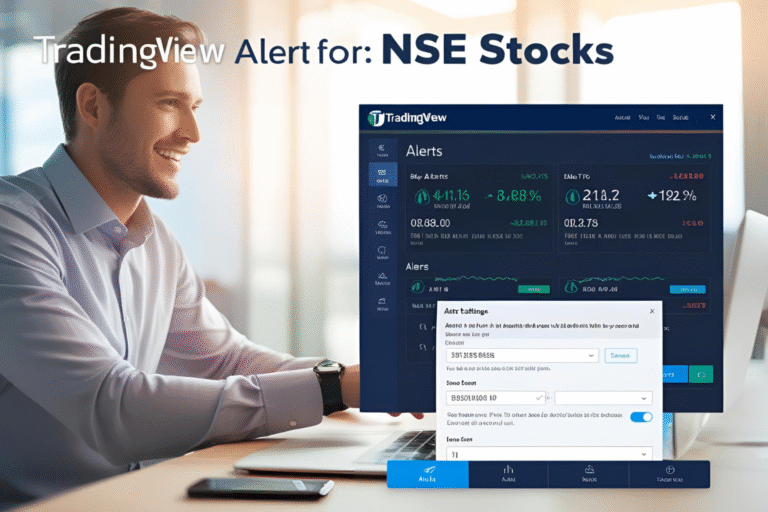
How to Set Up Alerts in TradingView for NSE Stocks

Alerts TradingView is one of the most powerful platforms for technical analysis—and its alert system is a major reason why. If you’re trading NSE stocks, setting up price and indicator-based alerts can help you monitor market conditions without staying glued to your screen. This tutorial walks you through the step-by-step process of setting up alerts…

How to Analyze Stocks on NSE with Technical Tools

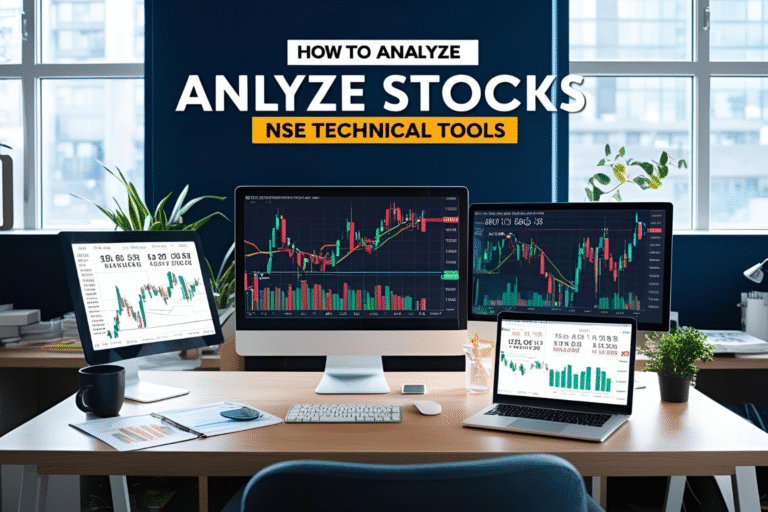
How to Analyze Stocks on NSE with Technical Tools

Analyzing stocks on the National Stock Exchange (NSE) is an essential skill for traders and investors in India. With the rise of platforms like TradingView, Chartink, and broker terminals like Zerodha Kite and Fyers One, technical analysis has become more accessible than ever. In this blog, we break down how to use technical tools effectively…

Create Custom Screens in Chartink

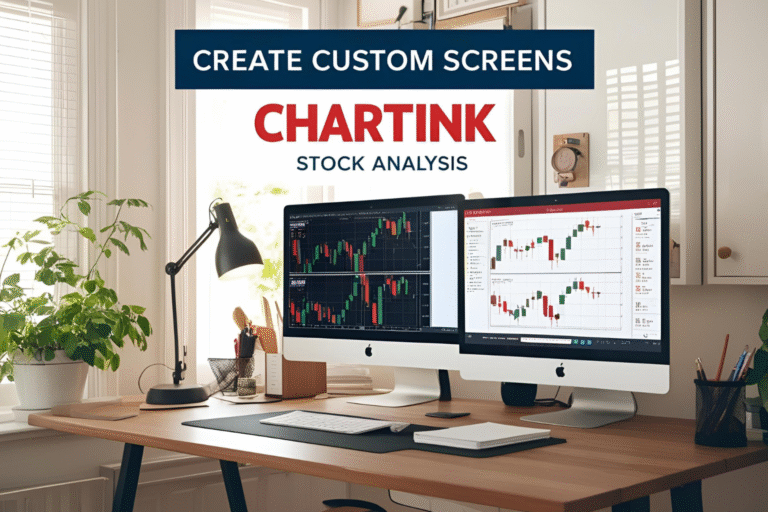
How to Create Custom Screens in Chartink

Step-by-Step: Creating a Custom Screener in Chartink 1. Access the Screener Tool 2. Define Your Filters For example, to filter stocks where the current close is above the 50-day EMA, set: You can add multiple filters to refine your scan further. 3. Set Timeframes and Offsets 4. Incorporate Custom Indicators (Optional) 5. Run and Save…